Understanding Statistical Tools and Techniques
CONTROL CHART
One of the key tools of Statistical Process Control (SPC) is a control chart. It is used to study and monitor a repetitive process, so that the process may remain in control.
Organizations use interrelated processes resulting output as a product. The outcome of a process is never exactly the same every time. Fluctuation or variability is an inevitable component of all processes or systems and it is expected. Fluctuation or variability arises naturally from the effects of miscellaneous chance events. If outcome of a process remains within the stable pattern, then we can say that the process is OK, but variation outside a stable pattern may be an indication that the process is not OK in a consistent manner. Event or outcome, finally beyond expected variability indicates that the process is out of control.
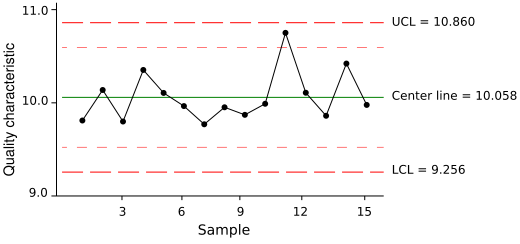
The control chart is a graph, which is used to show how a process changes over time. Data are plotted in time order. A control chart for a process has the following lines:
- A central line for the average
- An upper line for the upper control limit
- A lower line for the lower control limit
The values for the central line, upper line and lower line (i.e. control limits) are determined from historic data. These can be determined by computation based upon (i) the data covering past and current process records, (ii) statistical formulae whose reliability has been proved in practice. By comparing current data to these lines in the graph, one can come to the conclusion whether the process is in control or out of control. There are various types of control charts, divided in two groups – (i) Control chart for variables, and (ii) Control chart for attributes.
A control chart can be used:
- To control ongoing process by finding and correcting problems as they occur
- To predict the expected range of outcome from a process
- To determine whether a process is stable
- To analyze patterns of a process variations from special causes or common causes
- To determine whether improvement initiatives should aim to prevent specific problem or make changes to the process
Following procedure will be useful:
- Select the process that you wish to study, monitor or control
- Define the process control chart with average central line, upper control limit line and lower control limit line
- Determine the appropriate time period for collecting and plotting data
- Collect data and construct the control chart graph by plotting the data on the chart
- Analyze the graph, identify those signals which are ‘out-of-control’ on the chart and mark them on the graph
- Investigate the cause
- Document investigation process mentioning how investigated, what are the causes, what needs to be done to correct the ‘out-f-control’ situation
Standard control limits are located at 3-sigma away from the average or central line of the chart, known as 3-sigma limits. Control limits define a zone where observed data for a stable and consistent process occurs virtually all the time – 99.7%. Any fluctuations within these limits come from the common causes inherent to the process. Any fluctuations beyond the control limits results from a special cause that require fundamental change or improvement in the process. Any fluctuations beyond the control limits show that the process is out-of-control. When fluctuations are noticed beyond control limits then it is required to investigate and eliminate the special cause. Thus control chart can be used as a quality-monitoring tool.
How you liked the write-up. Please post your comments. Thanks.
No comments:
Post a Comment