Write ‘Yes’ for the statement you agree and ‘No’ for the statement you do not agree.
1. Quality is a fluid concept. - Yes / No
2. It is easy to manage quality. - Yes / No
3. W. Edward Deming says that quality is pride for workmanship. - Yes / No
4. According to the ISO definition of ‘quality’ means ‘degree to which a set of inherent characteristics fulfills customer expectations.’ - Yes / No
5. The fitness for purpose for quality can be judged by the customer, provider or an independent auditor. The independent auditor is the final judge. - Yes / No
6. The system of appraisal known as ‘quality control’ as a traditional method where ‘inspection’ is the king. - Yes / No
7. In order to remain in business, an organization has to provide goods and service of high quality, sale at the right price, meet delivery requirements and make a profit. - Yes / No
8. There can be two members from one country having ISO membership. - Yes / No
9. The objective of ISO is to promote the development of standardization and related activities in the world. - Yes / No
10. ISO 9000 is a mandatory system. - Yes / No
11. ISO 9001:2008 QMS Standard is a government regulation in India. - Yes / No
12. It is necessary to implement ISO 9001:2008 QMS Standard by organizations to seek SSI registration. - - Yes / No
13. Suppliers can establish standards of quality in their management systems and have assessed against ISO 9004:2009 international standard. - Yes / No
14. The quality management principles have been developed for use by the people of the organization in order to have better performance. - Yes / No
15. By predicting customer needs, an organization becomes customer focused organization. - Yes / No
16. Continual improvement is a requirement of ISO 9001:2008 QMS Standard and also a quality management principle. - Yes / No
17. Effective decision can be taken if an organization analyzes data and information in a proactive manner using ‘factual approach to decision making’ principle. - Yes / No
18. A desired result can be achieved more efficiently when all related resources and activities are managed as a process. - Yes / No
19. Appointing a consultant is necessary to implement ISO 9001:2008 QMS Standard. - Yes / No
20. The top management must appoint a ‘quality manager’ to coordinate QMS activities and also to give necessary directions to the people of the organization. - Yes / No
21. The responsibility and authority of ‘management representative’ can be assigned to an outside person. - Yes / No
22. It is necessary for the management representative to undergo lead auditor training. - Yes / No
23. An organization (in the absence of organization’s quality policy and quality objectives) can be granted ISO 9001:2008 QMS certification, if certification body finds the organization having met all other requirements of the ISO 9001:2008 QMS Standard. - Yes / No
24. If an organization has appointed a quality professional, then the organization is not required to appoint management representative for implementing ISO 9001:2008 QMS. - Yes / No
25. For implementing ISO 9001:2008 QMS, it is necessary to appoint a consultant. - Yes / No
26. International organization for Standardization (ISO) audit organizations and issues ISO 9001:2008 certificates. - Yes / No
27. International organization for Standardization (ISO) is the biggest certification body. - Yes / No
28. Management review forms an integral part of the quality management system and it should be conducted at planned intervals. - Yes / No
29. External audit and certification are mandatory requirements of ISO 9001:2008 QMS Standard. - Yes / No
30. An organization can implement ISO 9001:2008 QMS Standard only when it wishes to achieve its certification. - Yes / No
31. On implementing ISO 9001:2008 QMS Standard requirements, quality management system documentation of one organization cannot differ from another organization. - Yes / No
32. The ISO 9001:2008 QMS Standard lays down an emphasis on continual improvement of the quality management system. - Yes / No
33. Where an organization chooses to outsource any process that affects product conformity to requirements, the organization may relax control over such processes. - Yes / No
34. The intention of the ISO 9001:2008 QMS Standard is to imply uniformity in the structure of quality management system and uniformity of documentation. - Yes / No
35. Ensuring control over outsourced processes absolve the organization of the responsibility to fulfill all customer and legal requirements. - Yes / No
36. The quality management system documentation of an organization can be in any form or type of medium. - Yes / No
37. One copy of the quality management system documentation must be in hard copy. - Yes / No
38. It is mandatory for an organization to have documented procedure for control of documents, control of records, internal audit, control of purchasing, corrective action and preventive action. - Yes / No
39. All documents required by the quality management system of the organization are needed to be controlled as per requirements mentioned in clause 4.2.3 of ISO 9001:2008 QMS Standard. - Yes / No
40. Records required by the quality management system of the organization are needed to be controlled as per requirements mentioned in clause 4.2.4 of ISO 9001:2008 QMS Standard. - Yes / No
41. Approval of documents for adequacy may be obtained after issue of documents. - Yes / No
42. Reviewing documents means another look at the documents and this may be carried randomly or periodically. - Yes / No
43. Relevant versions of applicable documents along with obsolete documents must be available at points of use. - Yes / No
44. Management reviews is conducted at the convenience of the top management as and when they wish. - Yes / No
45. The detail and format of the quality manual of one organization cannot differ from another organization, if both organizations are implementing the same ISO 9001:2008 QMS Standard. - Yes / No
46. Quality objectives must be measurable. - Yes / No
47. ISO 9001:2008 QMS Standard stipulates that management review must be conducted at least once in a year. - Yes / No
48. ISO 9001:2008 QMS Standard stipulates that the organization must maintain appropriate record of human resources (such as attendance, leave records). - Yes / No
49. Personnel carrying out work affecting conformity to product requirements must be competent. - Yes / No
50. The organization must determine the necessary competence for all personnel. - Yes / No
51. The term ‘work environment’ relates to physical, environmental and other factors, human resources and also infrastructure facilities that organization has. - Yes / No
52. The term ‘work environment’ has been defined as a set of conditions under which work is performed. - Yes / No
53. No organization can take exclusion from design and development requirements as mentioned in clause 7.3 of ISO 9001:2008 QMS Standard. - Yes / No
54. If an organization is unable to conduct management review at defined intervals due to shortage of staff, then the organization can claim exclusion for management review requirements. - Yes / No
55. Internal audit is a one time activity. - Yes / No
56. An internal auditor is allowed to audit his/her own work. - Yes / No
57. The organization must conduct internal audit at defined intervals, however it is not necessary to maintain records of audit. - Yes / No
58. ISO 9001:2008 QMS Standard has defined the frequency of the internal audit. - Yes / No
59. If an organization has a good monitoring system and it conducts management review at defined intervals then there is no need to conduct internal audit. - Yes / No
60. It is mandatory to have a documented procedure for control of nonconforming product as per ISO 9001:2008 QMS Standard. - Yes / No
61. It is mandatory to have a documented procedure for analysis of data as per ISO 9001:2008 QMS Standard. - Yes / No
62. It is mandatory to have a documented procedure for continual improvement as per ISO 9001:2008 QMS Standard. - Yes / No
63. It is mandatory to have a documented procedure for corrective action as per ISO 9001:2008 QMS Standard. - Yes / No
64. It is mandatory to have a documented procedure for preventive action as per ISO 9001:2008 QMS Standard. - Yes / No
Do self assessment by reading different blog posts.
With best wishes,
KRS
Friday, April 6, 2012
A Short Course on ‘ISO 9001:2008 QMS Awareness’
Introduction
ISO 9001/2/3 standards series first published in 1987 and then revised in 1994.
Major revision in 2000 with publication of ISO 9001:2000 QMS Standard on 15 December 2000
Fourth edition – ISO 9001:2008 QMS Standard published on 15 November 2008
Overview
Clause 1 deals with scope including application
Clause 2 deals with references
Clause 3 deals with terms and definitions
Clause 4 to 8 deal with requirements of QMS
Clause 4 – Quality Management System
Clause 5 – Management Responsibility
Clause 6 – Resource management
Clause 7 – Product realization
Clause 8 – Measurement, analysis and improvement
Scope
ISO 9001:2008 QMS Standard specifies requirements for a QMS
Generic standard applicable to all organization regardless of its type, size and product
Exclusions are limited to requirements within clause 7 only.
References
Normative reference document
ISO 9000:2005, Quality management systems – Fundamental and vocabulary
Terms and definition
Terms and definitions as mentioned in ISO 9000 apply
Product include service
Quality Management System
General concept – Plan-Do-Check-Act (PDCA)
Determine processes, their application, sequence and interaction
Determine criteria and methods needed to ensure processes are effective
Provide necessary resources
Monitor, measure and analyze processes
Implement actions necessary to achieve planned results
Have continual improvement
Manage processes in accordance with requirements of ISO 9001:2008 QMS standard
Ensure control over outsourced processes
Quality Management System … Documentation
Remember – Say what you do, do what you say
Purpose – Effective planning, operation and control of QMS
Need documented quality policy
Need documented quality objectives
Need a quality manual
Need six documented procedures required by ISO 9001:2008 QMS standard
Need documents (procedures, work instructions etc.) determined by the organization
Maintain records required by ISO 9001:2008 QMS standard
Maintain records determined by the organization
Six documented procedures required by the Standard
- Control of documents
- Control of records
- Control of nonconforming product
- Internal audit
- Corrective action
- Preventive action
Management responsibility
Responsibility – Top management
Provide vision and commitment to quality
Communicate importance of meeting requirements (customer as well as legal)
Establish quality policy
Establish quality objectives
Conduct management reviews at planned intervals
Ensure availability of resources
Maintain customer focus
Ensure enhancement of customer satisfaction
Define duties and responsibilities
Assign someone from your management as management representative
Establish and use appropriate internal communication processes
Management responsibility …. Review the QMS
At planned (defined) intervals
Inputs to include from previous audits, customer, previous management reviews and information on process performance, product conformity, preventive action, corrective action, changes and recommendations in QMS
Output to cover decisions and actions on resource needs and improvement in QMS, processes and product.
Keep review records
Resource Management
Determine and provide resources (human and infrastructure including necessary equipment, tools and supporting services)
Engage competent work force
Determine necessary competence
Provide training or take other actions to achieve competence
Evaluate effectiveness of the training or action taken
Maintain records of education, training, skills and experience of your work force
Manage proper work environment
Product realization
Do proper planning
Determine and define – Product specifications, processes, documents and provide resources
Determine and define – Processes for verification, validation, monitoring, measurement, inspection and test activities for the product and product acceptance criteria
Determine and keep records needed
Product realization …
Determine what customer wants
Determine customer requirements, including requirements for delivery and after sales activities
Determine requirements not stated by customer but necessary for specified or intended use
Determine legal requirements applicable to the product and any additional requirements that you consider necessary
Make contract review that you can meet what customer wants
Keep contract review records
Determine and implement effective arrangements for customer communication
Product realization ….
Design and development of the product
Determine a design and development plan
Determine (define) design and development input requirements and maintain records
Verify that input requirements are met
Ensure that design and development output provide information on purchasing, production and service
Ensure that design and development outputs have product acceptance criteria and characteristics of the product for safe and proper use
Review the design and development process at suitable stages and keep records
Verify that design and development outputs meet design and development inputs and keep records
Validate the design and development process and keep records
Control changes to design and development and keep records
Product realization …
Purchasing activity
Purchase and use good product
Define what you want to purchase
Evaluate and select suppliers.
Maintain records of evaluation.
Communicate to your supplier what you want to purchase
Verify your purchase against what you ordered
Product realization …
Control your production and service activities
Plan and carry out production and service activities under controlled conditions
Validate processes where resulting output can’t be verified by subsequent monitoring or measurement
Identify product throughout product realization process
Where traceability is a requirement, control unique identification of the product and maintain records
If you use customer property, exercise due care. Report where customer property is lost, damaged or found unsuitable for use and maintain records.
Preserve the product during product realization and delivery to intended destination
Product realization …
Check the monitoring and measuring equipment
Determine the equipment
Control the equipment
Make sure the equipment is calibrated or verified
Keep records of calibration and verification
Measurement, analysis and improvement
Plan and implement monitoring, measurement, analysis and improvement processes to ensure product conformity with requirements, conformity of the QMS and improvement of the effectiveness of the QMS
Monitor information relating to customer perception
Carry out Internal audit at planned intervals and keep records of audits
Monitor and measure internal processes
Monitor and measure product
Control nonconforming product to prevent unintended use or delivery. Keep appropriate records of nonconformities and actions taken
Collect and analyze appropriate data and analyze
Continually improve the QMS effectiveness.
Take corrective and preventive actions and keep records of results of action taken
Suggested to refer to ISO 9001:2008 QMS and ISO 9000:2005 Standards
Thanks,
Keshav Ram Singhal

Where can I get more articles?
This article is included in ‘Awareness Series on QMS’ containing more than 50 articles edited by KESHAV RAM SINGHAL. You can get this series by sending your subscription that is very nominal. You should send an email to keshavsinghalajmer@gmail.com asking subscription details of the Awareness Series on QMS.
I need Training or Consultancy help. Can you help?
Yes, we can certainly help you. We are expertise in implementation steps and can help you fast track your way to an effective and profitable QMS. We can provide you online training and/or consultancy help. If you need help in developing or implementing your ISO 9001:2008 QMS, please email us at keshavsinghalajmer@gmail.com giving details of your requirements.
Your Feedback is valuable
If you feel this article is informative or if you would like to provide us your feedback, do send us an email with your comments or write your comments in the space provided below the article. If you feel this blog could help your supplier, customer or other business associate, feel free to refer this blog to them.
Thursday, February 23, 2012
Statutory and Regulatory Requirements in ISO 9001:2008 QMS
Dr. Divya Singhal
&
Keshav Ram Singhal
Not less than nine times the term ‘statutory and regulatory requirements’ has been stated in the ISO 9001:2008 QMS Standard. This article is an attempt to understand the meaning of the term, and what and how organization needs to comply it.
The term ‘statutory and regulatory requirements’ are legal requirements as clarified in Note 2 under the clause 1.1 (General) of ISO 9001:2008 QMS Standard. This term expresses two types of requirements:
(i) Statutory requirements
(ii) Regulatory requirements
Both statutory requirements and regulatory requirements are those requirements that are required by law. These requirements are non-negotiable and must be complied with. Failure to comply a legal requirement may result in a fine or penalty and possibly a custodial sentence for the person or persons responsible for such failure. Statutory refers to laws passed by a state and/or central government, while regulatory refers to a rule issued by a regulatory body appointed by a state and/or central government.
Statutory requirements are those requirements which are applicable by virtue of law enacted by the government. A regulatory requirement can be termed as administrative legislation that constitutes or constraints rights and allocates responsibilities. It is somewhat different from the statutory legislation enacted by passing the law in the legislative assembly or parliament. There can be following types of regulations applicable on an organization:
- Legal restrictions or responsibilities promulgated by a government authority
- Self regulation by an industry through trade association
ISO 9001:2008 QMS Standard requires an organization to determine and control the statutory and regulatory requirements applicable to the organization’s products (including services). It is up to the organization how to comply this within its quality management system. On perusal of ISO 9001:2008 QMS Standard, we find, in the introduction part of the standard indicates that the standard, ISO 9001:2008 QMS, can be used by parties to assess organization’s ability to meet:
- Customer requirements
- Statutory and regulatory requirements applicable to the product
- Organization’s own requirements
So it is for the people involved in assessing the organization’s quality management system, such as third party auditors and internal auditors, need to be aware of the general and specific statutory and regulatory requirements applicable to the product within the scope of the quality management system.
The term ‘statutory and regulatory requirements’ has been used four times in clause 1 (Scope) – two times in mentioning the general scope of the standard in clause 1.1, one time in explaining the term in the note 2 under clause 1.1 and one time in mentioning the application in clause 1.2 of the standard. Accordingly, an organization, wishes to implement ISO 9001:2008 QMS Standard, needs to (i) consistently provide product that must meet applicable statutory and regulatory requirements, (ii) apply effective management system that aims to comply applicable statutory and regulatory requirements, (iii) ensure that any exclusions within clause 7 of the Standard do not affect the organization’s ability or responsibility to provide product that meets requirements.
Even in case of an outsourced process, it is the responsibility of the organization to comply statutory and regulatory requirements. This is clarified in note 3 under clause 4.1 (General requirements) of the Standard.
The Standard, in its clause 5.1 (Management commitment), has provided responsibility on the part of the top management to communicate the importance of meeting statutory and regulatory requirements and, in clause 7.2.1 (Determination of requirements related to the product), it requires the organization to determine statutory and regulatory requirements applicable to the product. Clause 7.3.2 (Design and development inputs) of the standard requires including statutory and regulatory requirements in the design input and reviewing it for adequacy.
Accordingly, the organization should have a methodology in place (i) for determining, maintaining and updating all applicable statutory and regulatory requirements, (ii) for communicating all applicable statutory and regulatory requirements within the organization. The organization should ensure that determined statutory and regulatory requirements are utilized as ‘process inputs’. The organization should monitor ‘process outputs’ for compliance with statutory and regulatory requirements.
In this regard, one suggestion could be to have a task-force team in place comprising of one In-charge and a few members, having legal knowledge or background. Task-force team should determine the applicable statutory and regulatory requirements applicable to the product and to the organization, and also ascertain the responsibility of personnel/departments in meeting these determined requirements. Task-force members may also study the national/international level best practices in this regard to gain ideas about smooth implementation of such requirements. The In-charge should ensure: communication of determined statutory and regulatory requirements to the management representative and personnel/departments concerned with a copy to the top management.
It should be the responsibility of the personnel/departments concerned to meet these determined requirements. The top management should also review at defined intervals meeting applicable statutory and regulatory requirements.
The term ‘statutory and regulatory requirements’ is invisible in clause 8 (Measurement, analysis and improvement), however internal auditors can play a significant role in meeting statutory and regulatory requirements. It will be a good idea that the auditor during the audit preparation phase obtains relevant information from internal as well as external sources with respect to the statutory and regulatory requirements that may apply to the organization and its product, such as, legal requirements related to health, safety and environment. An internal auditor can find the compliance during audit process by inquiring to the following:
- Whether the organization has determined applicable statutory and regulatory requirements related to the product?
- What are the determined applicable statutory and regulatory requirements?
- How the organization’s people are communicated the importance of meeting statutory and regulatory requirements?
- Whether the determined statutory and regulatory requirements are utilized as process inputs in determination of requirements related to the product and also in reviewing design and development inputs.
In case the auditor finds any noncompliance to any of the statutory and regulatory requirements, it should be reported as CAR (corrective action request) and such action will help the organization in improving the effectiveness of the organization’s quality management system.
Tuesday, February 21, 2012
QUESTION-ANSWER FORUM
Question: It is not very clear what exactly is the difference between the process approach and system approach. Please explain.
Answer: Unfortunately, people confuse the term ‘process’ and ‘system’. It is necessary to understand both terms clearly. A process is a set of interrelated or interacting activities, which transforms inputs into outputs. The process of a business is the totality of all of the individual activities that the business performs. The process includes identifying a customer need, creating a product or service concept to meet the need, defining how that concept will be executed, executing or deploying the concept, measuring customer satisfaction, and continually improving both concepts and deployment. To manage the process, the organization develops management systems, including financial, human resources, materials, quality, environmental, health and safety, and other management systems. Some of these systems will meet the international Standards, such as ISO 9001: 2008 QMS Standard.
‘Process approach’ requires determination of processes, interactions of the determined processes and their management. In this connection, general requirements mentioned in clause 1.1 of the ISO 9001:2008 QMS Standard are relevant.
Ongoing control is one advantage of the process approach. Process approach provides over the linkage between the individual processes within the system of processes, as well as over their combination and interaction. A process approach (when used in the quality management system) emphasizes importance of:
• Understanding customer requirements, applicable statutory and regulatory requirements and organization’s own requirements
• Fulfilling customer requirements, applicable statutory and regulatory requirements and organization’s own requirements
• The need to consider processes in terms of added value
• Continual improvement of processes based on objective measurement
In each such system, there are number of component processes. The summation of these component processes constitutes the specific management system. Typical processes in the quality management system include leadership, planning, administration, purchasing, training, design and development, production and service, operations, measurement, audit, corrective and preventive actions, and improvement.
A process map is a very significant tool as part of quality management system of an organization. Part of creating this map is defining where process starts and ends and determining: the specific activities that need to be performed, the process owners for each of the activities, and customer satisfaction measures. From this map, the organization can begin to define which QMS-related processes are involved and how organization can flowchart them in detail, improve them, update the flowchart, and document, deploy and maintain the process.
I hope the matter is clear.
With best wishes,
KRS
Monday, February 20, 2012
The term 'statutory and regulatory requirements'
How many times the term 'statutory and regulatory requirements' used in ISO 9001:2008 QMS Standard?
One - Clause 0.1 (General)
Three - Clause 1.1 (Scope - General)
One - Clause 1.2 (Scope - Application)
One - Clause 4.1 (QMS - General requirements)
One - Clause 5.1 (Management commitment)
One - Clause 7.2.1 (Determination of requirements related to the product)
One - Clause 7.3.2 (Design and development inputs)
Do you find anywhere the term 'statutory and regulatory requirements' in clause 8 (Measurement, analysis and improvement) requirements?

The term 'statutory and regulatory requirements' is invisible in clause 8, however internal auditors can play a significant role in meeting statutory and regulatory requirements. It will be a good idea that the auditor during the audit preparation phase obtains relevant information from internal as well as external sources with respect to the statutory and regulatory requirements that may apply to the organization and its product, such as, legal requirements related to health, safety and environment.
In case the auditor finds any noncompliance to any of the statutory and regulatory requirements, it should be reported as CAR (corrective action request) and such action will help the organization in improving the effectiveness of the organization’s quality management system.
What is your opinion?
With best wishes,
KRS
Tuesday, February 7, 2012
STRATIFICATION
Write-up – 10
Understanding Statistical Tools and Techniques
STRATIFICATION
Stratification is a statistical tool used in combination with other analysis tool. When data from a variety of sources or categories lump together, it is difficult to visualize the meaning of data. Stratification technique separates the data so that pattern of the data can be seen.
Stratification is a technique used to analyze or divide a universe of data into homogeneous groups (strata) often data collected about a problem or event represents multiple sources that need to be treated separately. It involves looking at process data, splitting it into distinct layers (almost like a rock is stratified) and doing analysis to possibly see a process improvement. Stratification is related to segmentation, but it is different from segmentation.
Following procedure will be useful:
- Before collecting data, consider the information and sources of data that can have effect on the results. Plan to collect stratification information.
- After collecting data, when you plot or graph the collected data on scatter diagram or control chart or histogram or any other analysis tool, use different marks or colours to differentiate data from various sources.
- Data plotted or graphed that differentiate from each other are said to be stratified.
- Analyze subsets of stratified data separately.
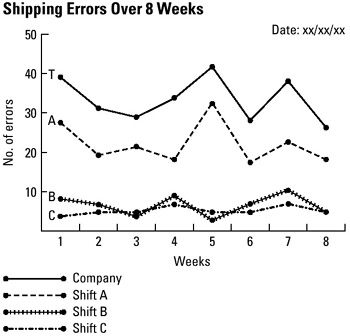
Some examples of different sources that may require data to be stratified are different equipment, shifts, departments, materials, suppliers, products, days or time.
Thus, analysis of survey data can be benefited from stratification technique.
How you liked the write-up. Please post your comments. Thanks.
Understanding Statistical Tools and Techniques
STRATIFICATION
Stratification is a statistical tool used in combination with other analysis tool. When data from a variety of sources or categories lump together, it is difficult to visualize the meaning of data. Stratification technique separates the data so that pattern of the data can be seen.
Stratification is a technique used to analyze or divide a universe of data into homogeneous groups (strata) often data collected about a problem or event represents multiple sources that need to be treated separately. It involves looking at process data, splitting it into distinct layers (almost like a rock is stratified) and doing analysis to possibly see a process improvement. Stratification is related to segmentation, but it is different from segmentation.
Following procedure will be useful:
- Before collecting data, consider the information and sources of data that can have effect on the results. Plan to collect stratification information.
- After collecting data, when you plot or graph the collected data on scatter diagram or control chart or histogram or any other analysis tool, use different marks or colours to differentiate data from various sources.
- Data plotted or graphed that differentiate from each other are said to be stratified.
- Analyze subsets of stratified data separately.
Some examples of different sources that may require data to be stratified are different equipment, shifts, departments, materials, suppliers, products, days or time.
Thus, analysis of survey data can be benefited from stratification technique.
How you liked the write-up. Please post your comments. Thanks.
Monday, February 6, 2012
SCATTER DIAGRAM
Write-up – 9
Understanding Statistical Tools and Techniques
SCATTER DIAGRAM
A scatter diagram is a graphical representation of two variables showing the relationship between them. If variables are correlated, the points will fall along a line or a curve. This diagram is also known as a scatter plot, x-y graph, or correlation chart. It is a problem solving tool.
We can use scatter diagram when we may have paired numerical data and one variable data is dependent on other variable. Scatter diagram can be constructed by plotting two variables against one another on a pair of axes. With the help of scatter diagram, we can try to determine whether two variables are related and potential root causes of problems.

It will be useful to draw scatter diagram after brainstorming causes and effects using a cause and effect diagram to determine whether a particular cause and effect are related. A scatter diagram is used to uncover possible cause-and-effect relationship.
Following procedure will be useful to construct a scatter diagram:
- Decide two variables against which you wish to see the relationship
- Collect pairs of data of these two variables
- Draw a graph with independent variable on the horizontal axis and the dependent variable on the vertical axis
- For each pair of data, put a dot or symbol where x-axis value intersect y-axis value
- Look at the pattern of dots (or symbols) to see if a relationship is obvious
- If data form a line or a curve, it indicates that variables are correlated

When data forms a line or curve, then you may use regression analysis or correlation analysis by using following steps:
- Decide the points from top to bottom by drawing horizontal line
- Divide the points from left to right by drawing a vertical line
- If number of points is odd, you should draw the line through the middle point
- In this way, you will be able to divide points on the graph into four quadrants
- Count the points in each quadrant (leaving the point on the line)
- Add diagonally opposite quadrants
- Find smaller sum and total of points in all quadrants
- A = points in upper left + points in lower right
- B = points in upper right + points in lower left
- Q = the smaller of A and B
- N = A + B
- Look up the limit for N on the trend test table

- If Q is less than the limit, two variables are related
- If q is greater than or equal to the limit, the pattern could have occurred from random chance and we can say that no relationship is demonstrated
How you liked the write-up. Please post your comments. Thanks.
Understanding Statistical Tools and Techniques
SCATTER DIAGRAM
A scatter diagram is a graphical representation of two variables showing the relationship between them. If variables are correlated, the points will fall along a line or a curve. This diagram is also known as a scatter plot, x-y graph, or correlation chart. It is a problem solving tool.
We can use scatter diagram when we may have paired numerical data and one variable data is dependent on other variable. Scatter diagram can be constructed by plotting two variables against one another on a pair of axes. With the help of scatter diagram, we can try to determine whether two variables are related and potential root causes of problems.
It will be useful to draw scatter diagram after brainstorming causes and effects using a cause and effect diagram to determine whether a particular cause and effect are related. A scatter diagram is used to uncover possible cause-and-effect relationship.
Following procedure will be useful to construct a scatter diagram:
- Decide two variables against which you wish to see the relationship
- Collect pairs of data of these two variables
- Draw a graph with independent variable on the horizontal axis and the dependent variable on the vertical axis
- For each pair of data, put a dot or symbol where x-axis value intersect y-axis value
- Look at the pattern of dots (or symbols) to see if a relationship is obvious
- If data form a line or a curve, it indicates that variables are correlated
When data forms a line or curve, then you may use regression analysis or correlation analysis by using following steps:
- Decide the points from top to bottom by drawing horizontal line
- Divide the points from left to right by drawing a vertical line
- If number of points is odd, you should draw the line through the middle point
- In this way, you will be able to divide points on the graph into four quadrants
- Count the points in each quadrant (leaving the point on the line)
- Add diagonally opposite quadrants
- Find smaller sum and total of points in all quadrants
- A = points in upper left + points in lower right
- B = points in upper right + points in lower left
- Q = the smaller of A and B
- N = A + B
- Look up the limit for N on the trend test table
- If Q is less than the limit, two variables are related
- If q is greater than or equal to the limit, the pattern could have occurred from random chance and we can say that no relationship is demonstrated
How you liked the write-up. Please post your comments. Thanks.
Thursday, February 2, 2012
PARETO CHART
Write-up – 8
Understanding Statistical Tools and Techniques
PARETO CHART
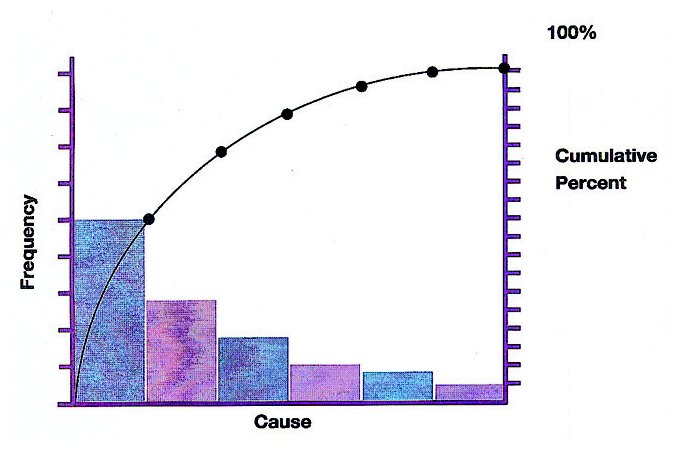
A pareto chart looks like a bar graph, but it contains both bars and a line graph. It is one of the basic tools of quality control. The length of the bars in the graph represents frequency or cost (time or money). These bars are arranged with longest bar on the left and shortest to the right. This is a tool which can be used to analyze the ideas from brainstorming session. This tool is also known as Pareto diagram or Pareto analysis. This tool is used to identify the vital few problems or causes of problems that have the greatest impact on the process. This chart pictorially represents data in the form of a ranked bar chart that shows the frequency of occurrence of items in descending order. The Pareto chart is named after Wilfried Fritz Pareto, an Italian engineer, sociologist, economist, political scientist and philosopher. He introduced the concept of Pareto efficiency.
It is significant to use Pareto chart:
- To analyze data about frequency of problems or causes of problems in a process
- To focus on the most significant problem or cause, when there are many problems or causes
- To analyze broad causes
- To communicate with others about the data
Following procedure will be useful to use Pareto chart and its analysis:
- Decide the categories of group items
- Decide approximate measurement (frequency, quantity, cost, or time)
- Decide the time period to gather data and use in the Pareto chart (one work cycle, one full day, or one week)
- Collect data, record and assemble data for the category each time
- Subtotal the measurements for each category
- Determine the appropriate scale for the measurements data collected
- Mark the scale on the left side of the chart
- Construct and label bars for each category by placing the tallest to the left, next tallest to its right and so on
- Calculate the percentage for each category
- Draw a right vertical axis and label it with percentage in a graph paper. Be sure that left measurement corresponds to one-half and it should be exactly opposite 50% on the right scale.
- Calculate and draw cumulative sums
- Add the subtotals for the first category and second category and place a dot above the second bar indicating the sum, then add subtotal of third category to the sum and place a dot above the third bar indicating the new sum and so on. Continue the adding subtotals and placing dots for all bars.
- Connect the dots, starting from the top of first bar. The last dot should reach 100 percent on the right side
In this way we can visualize the most important factors among a typically large set of factors through the Pareto chart. A Pareto chart often represents the most common sources of defects, the highest occurring type of defect, or the most frequent reasons for problems.
How you liked the write-up. Please post your comments. Thanks.
Understanding Statistical Tools and Techniques
PARETO CHART
A pareto chart looks like a bar graph, but it contains both bars and a line graph. It is one of the basic tools of quality control. The length of the bars in the graph represents frequency or cost (time or money). These bars are arranged with longest bar on the left and shortest to the right. This is a tool which can be used to analyze the ideas from brainstorming session. This tool is also known as Pareto diagram or Pareto analysis. This tool is used to identify the vital few problems or causes of problems that have the greatest impact on the process. This chart pictorially represents data in the form of a ranked bar chart that shows the frequency of occurrence of items in descending order. The Pareto chart is named after Wilfried Fritz Pareto, an Italian engineer, sociologist, economist, political scientist and philosopher. He introduced the concept of Pareto efficiency.
It is significant to use Pareto chart:
- To analyze data about frequency of problems or causes of problems in a process
- To focus on the most significant problem or cause, when there are many problems or causes
- To analyze broad causes
- To communicate with others about the data
Following procedure will be useful to use Pareto chart and its analysis:
- Decide the categories of group items
- Decide approximate measurement (frequency, quantity, cost, or time)
- Decide the time period to gather data and use in the Pareto chart (one work cycle, one full day, or one week)
- Collect data, record and assemble data for the category each time
- Subtotal the measurements for each category
- Determine the appropriate scale for the measurements data collected
- Mark the scale on the left side of the chart
- Construct and label bars for each category by placing the tallest to the left, next tallest to its right and so on
- Calculate the percentage for each category
- Draw a right vertical axis and label it with percentage in a graph paper. Be sure that left measurement corresponds to one-half and it should be exactly opposite 50% on the right scale.
- Calculate and draw cumulative sums
- Add the subtotals for the first category and second category and place a dot above the second bar indicating the sum, then add subtotal of third category to the sum and place a dot above the third bar indicating the new sum and so on. Continue the adding subtotals and placing dots for all bars.
- Connect the dots, starting from the top of first bar. The last dot should reach 100 percent on the right side
In this way we can visualize the most important factors among a typically large set of factors through the Pareto chart. A Pareto chart often represents the most common sources of defects, the highest occurring type of defect, or the most frequent reasons for problems.
How you liked the write-up. Please post your comments. Thanks.
Wednesday, February 1, 2012
HISTOGRAM
Write-up – 7
Understanding Statistical Tools and Techniques
HISTOGRAM
A histogram is a snapshot of variation or distribution, where data are grouped into cells and their frequency represented as bars. It is a commonly used graph to show frequency distribution. It looks like a bar chart, but it is different from the bar chart. We can put the data from the check sheets into a histogram. A histogram is a set of vertical bars whose areas are proportional to the frequency represented.
The histogram helps in analyzing the capability of a process. The variables being measured are shown along x-axis and the frequency occurrences of each measurement is charted along y-axis.
A histogram is convenient for large amounts of data particularly when the range is wide. It gives a picture of the extent of variation. It highlights unusual areas and indicates probability of particular values occurring. Histogram depicts the central tendency or mean of the data and its variation or spread.
A histogram is useful in showing characteristics of the process being measured, such as:
- Whether results of the process show a normal distribution – a bell curve?
- Whether the range of the data indicates that the process is capable of producing product as per defined specifications?
- How much improvement is necessary to meet specifications?
It is convenient to use histogram when data are numerical and we want to see the shape of data distribution to determine whether the output of a process shows normal distribution.
Following procedure will be useful:
- Decide a process to observe
- Collect at least 50 consecutive data points from the process
- Use histogram worksheet to set up histogram
- Draw x- and y-axes on the graph paper. Y-axes should be used mark and label for counting data values (frequency values) and x-axis to mark and label with variable values from the histogram worksheet.
For using histogram, we need to use histogram worksheet to set up the histogram on graph paper. Histogram worksheet helps in determining the number of bars, the range of numbers that go into each bar and labels for the bar edge.
How you liked the write-up. Please post your comments. Thanks.
CONTROL CHART
Write-up – 6
Understanding Statistical Tools and Techniques
CONTROL CHART
One of the key tools of Statistical Process Control (SPC) is a control chart. It is used to study and monitor a repetitive process, so that the process may remain in control.
Organizations use interrelated processes resulting output as a product. The outcome of a process is never exactly the same every time. Fluctuation or variability is an inevitable component of all processes or systems and it is expected. Fluctuation or variability arises naturally from the effects of miscellaneous chance events. If outcome of a process remains within the stable pattern, then we can say that the process is OK, but variation outside a stable pattern may be an indication that the process is not OK in a consistent manner. Event or outcome, finally beyond expected variability indicates that the process is out of control.
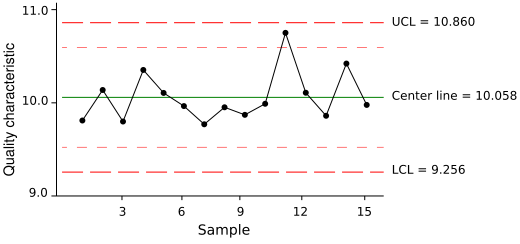
The control chart is a graph, which is used to show how a process changes over time. Data are plotted in time order. A control chart for a process has the following lines:
- A central line for the average
- An upper line for the upper control limit
- A lower line for the lower control limit
The values for the central line, upper line and lower line (i.e. control limits) are determined from historic data. These can be determined by computation based upon (i) the data covering past and current process records, (ii) statistical formulae whose reliability has been proved in practice. By comparing current data to these lines in the graph, one can come to the conclusion whether the process is in control or out of control. There are various types of control charts, divided in two groups – (i) Control chart for variables, and (ii) Control chart for attributes.
A control chart can be used:
- To control ongoing process by finding and correcting problems as they occur
- To predict the expected range of outcome from a process
- To determine whether a process is stable
- To analyze patterns of a process variations from special causes or common causes
- To determine whether improvement initiatives should aim to prevent specific problem or make changes to the process
Following procedure will be useful:
- Select the process that you wish to study, monitor or control
- Define the process control chart with average central line, upper control limit line and lower control limit line
- Determine the appropriate time period for collecting and plotting data
- Collect data and construct the control chart graph by plotting the data on the chart
- Analyze the graph, identify those signals which are ‘out-of-control’ on the chart and mark them on the graph
- Investigate the cause
- Document investigation process mentioning how investigated, what are the causes, what needs to be done to correct the ‘out-f-control’ situation
Standard control limits are located at 3-sigma away from the average or central line of the chart, known as 3-sigma limits. Control limits define a zone where observed data for a stable and consistent process occurs virtually all the time – 99.7%. Any fluctuations within these limits come from the common causes inherent to the process. Any fluctuations beyond the control limits results from a special cause that require fundamental change or improvement in the process. Any fluctuations beyond the control limits show that the process is out-of-control. When fluctuations are noticed beyond control limits then it is required to investigate and eliminate the special cause. Thus control chart can be used as a quality-monitoring tool.
How you liked the write-up. Please post your comments. Thanks.
Understanding Statistical Tools and Techniques
CONTROL CHART
One of the key tools of Statistical Process Control (SPC) is a control chart. It is used to study and monitor a repetitive process, so that the process may remain in control.
Organizations use interrelated processes resulting output as a product. The outcome of a process is never exactly the same every time. Fluctuation or variability is an inevitable component of all processes or systems and it is expected. Fluctuation or variability arises naturally from the effects of miscellaneous chance events. If outcome of a process remains within the stable pattern, then we can say that the process is OK, but variation outside a stable pattern may be an indication that the process is not OK in a consistent manner. Event or outcome, finally beyond expected variability indicates that the process is out of control.
The control chart is a graph, which is used to show how a process changes over time. Data are plotted in time order. A control chart for a process has the following lines:
- A central line for the average
- An upper line for the upper control limit
- A lower line for the lower control limit
The values for the central line, upper line and lower line (i.e. control limits) are determined from historic data. These can be determined by computation based upon (i) the data covering past and current process records, (ii) statistical formulae whose reliability has been proved in practice. By comparing current data to these lines in the graph, one can come to the conclusion whether the process is in control or out of control. There are various types of control charts, divided in two groups – (i) Control chart for variables, and (ii) Control chart for attributes.
A control chart can be used:
- To control ongoing process by finding and correcting problems as they occur
- To predict the expected range of outcome from a process
- To determine whether a process is stable
- To analyze patterns of a process variations from special causes or common causes
- To determine whether improvement initiatives should aim to prevent specific problem or make changes to the process
Following procedure will be useful:
- Select the process that you wish to study, monitor or control
- Define the process control chart with average central line, upper control limit line and lower control limit line
- Determine the appropriate time period for collecting and plotting data
- Collect data and construct the control chart graph by plotting the data on the chart
- Analyze the graph, identify those signals which are ‘out-of-control’ on the chart and mark them on the graph
- Investigate the cause
- Document investigation process mentioning how investigated, what are the causes, what needs to be done to correct the ‘out-f-control’ situation
Standard control limits are located at 3-sigma away from the average or central line of the chart, known as 3-sigma limits. Control limits define a zone where observed data for a stable and consistent process occurs virtually all the time – 99.7%. Any fluctuations within these limits come from the common causes inherent to the process. Any fluctuations beyond the control limits results from a special cause that require fundamental change or improvement in the process. Any fluctuations beyond the control limits show that the process is out-of-control. When fluctuations are noticed beyond control limits then it is required to investigate and eliminate the special cause. Thus control chart can be used as a quality-monitoring tool.
How you liked the write-up. Please post your comments. Thanks.
Subscribe to:
Posts (Atom)