Understanding Statistical Tools and Techniques
HISTOGRAM
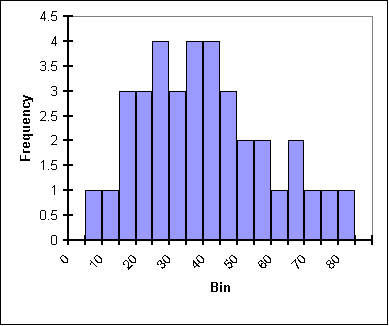
A histogram is a snapshot of variation or distribution, where data are grouped into cells and their frequency represented as bars. It is a commonly used graph to show frequency distribution. It looks like a bar chart, but it is different from the bar chart. We can put the data from the check sheets into a histogram. A histogram is a set of vertical bars whose areas are proportional to the frequency represented.
The histogram helps in analyzing the capability of a process. The variables being measured are shown along x-axis and the frequency occurrences of each measurement is charted along y-axis.

A histogram is convenient for large amounts of data particularly when the range is wide. It gives a picture of the extent of variation. It highlights unusual areas and indicates probability of particular values occurring. Histogram depicts the central tendency or mean of the data and its variation or spread.
A histogram is useful in showing characteristics of the process being measured, such as:
- Whether results of the process show a normal distribution – a bell curve?
- Whether the range of the data indicates that the process is capable of producing product as per defined specifications?
- How much improvement is necessary to meet specifications?

It is convenient to use histogram when data are numerical and we want to see the shape of data distribution to determine whether the output of a process shows normal distribution.
Following procedure will be useful:
- Decide a process to observe
- Collect at least 50 consecutive data points from the process
- Use histogram worksheet to set up histogram
- Draw x- and y-axes on the graph paper. Y-axes should be used mark and label for counting data values (frequency values) and x-axis to mark and label with variable values from the histogram worksheet.
For using histogram, we need to use histogram worksheet to set up the histogram on graph paper. Histogram worksheet helps in determining the number of bars, the range of numbers that go into each bar and labels for the bar edge.
How you liked the write-up. Please post your comments. Thanks.
1 comment:
Nice explanation about Histogram and I am sharing a simple definition about it as-A graphical representation which shows a visual impression of the distribution of data termed as Histogram . Histogram consists of tabular frequencies which are shown as adjacent rectangles, with an area equal to the frequency of the observations in the interval.
what is a vertical angle
Post a Comment